Stories
Combine a selection of graphs into one place and save as a PDF or PowerPoint slides.
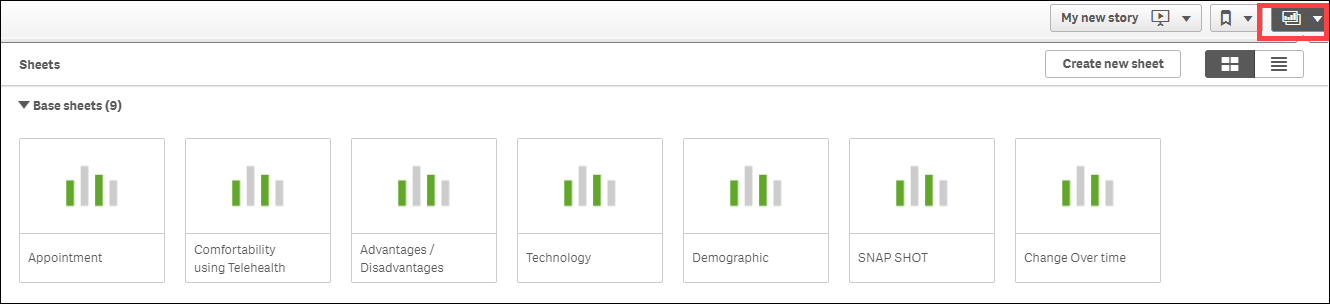
1. Take Snapshot of Graphs for the Story
|
|
2. Build the Story using the Snapshots
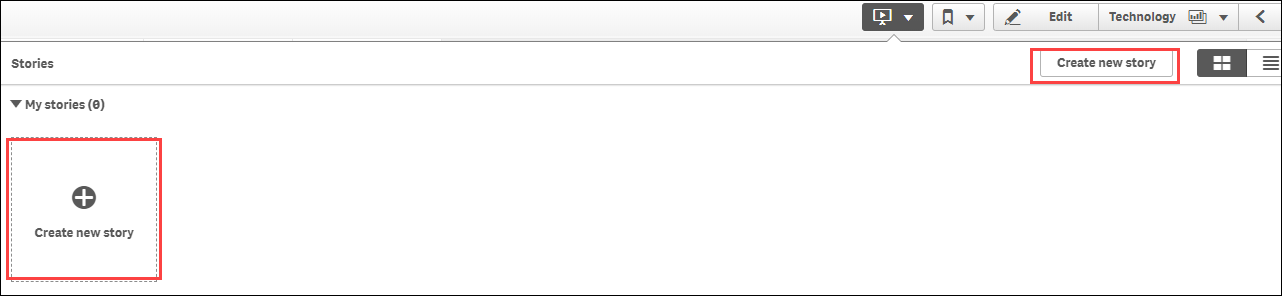
- Click the Storytelling tab in the middle of the top menu bar

- The Stories window opens. Click My new story in top right corner or within the window.
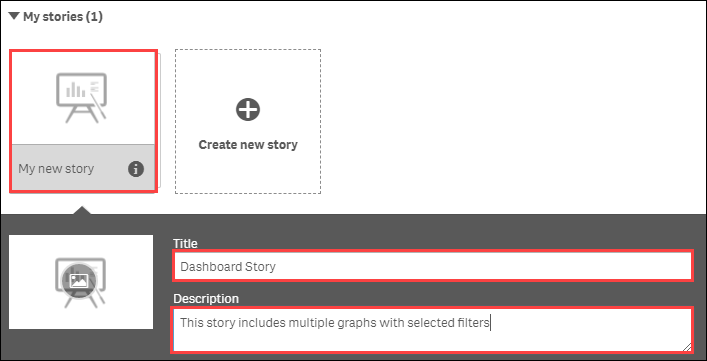
- In the pop up type the Title and Description (optional)
- Click My New Story to save and open the new Story
- Click the camera icon
 on top right to access the Snapshot library
- Click and drag a snapshot onto the blank page
- Repeat to select more graphs
- Move graphs around the page using click and drag. Resize using the toggles in the corners
- Click the plus sign
 at the bottom left of page to add an additional page.
- Stories can also be used to add text, shapes and highlight data elements. Select the icon that represents what you want to add, then click and drag from the menu onto your page/graphs.
- Stories automatically saves the work
- To exit Stories and return to the Dashbaord, click the Sheets Icon
 in the top right corner, then select the tab you wish to return to