
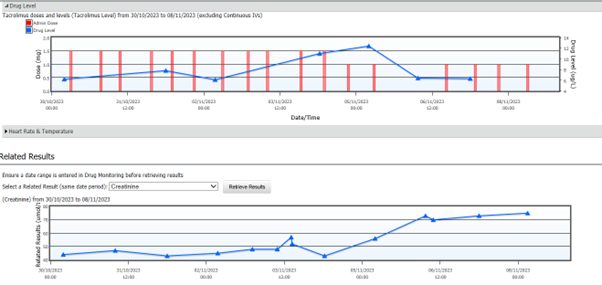
A Therapeutic Drug Monitoring tab has been added to Medication & Fluid Monitoring in PowerChart & FirstNet
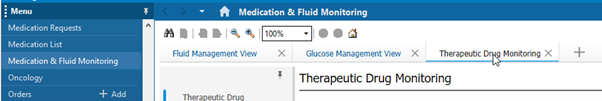
This page allows graphing of drugs and the matching drug levels on the same chart.
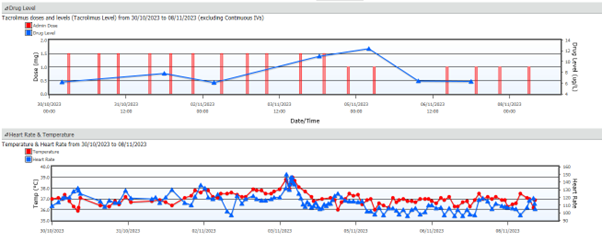
- Choose the drug, and the desired date range
- The start and end dates for the date range must be 3 weeks or less apart
![]()
- Click Retrieve Results
- Graphs for the Drug Level, and Heart Rate/Temperature will return results from that date range
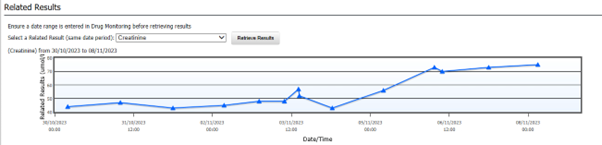
The Related Results component will chart results for a specified pathology test for the same period
- Choose the Related Result type, and click Retrieve Results
- Note there must be a date period entered at the top of the page first
TIP:
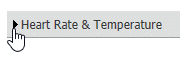
- Click the triangle icon for Heart Rate & Temperature to hide that graph, so the Drug Level and Related Results can be seen side by side
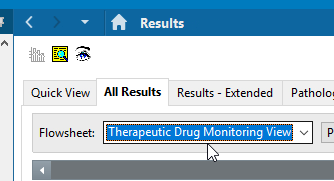
- The list of Related Results is the same as displayed as Related Results on the Therapeutic Drug Monitoring Flowsheet (under All Results Flowsheet – see https://learning.schn.health.nsw.gov.au/powerchart-firstnet-therapeutic-drug-monitoring-view-results)
TIPS:
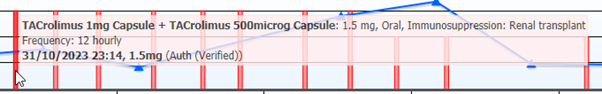
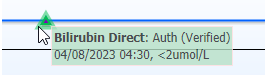
- Hover over data point or the bars to see the result or drug administration details
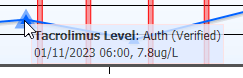
- A green icon indicates the result was posted as less than or ‘greater than’ rather than straight numbers
Other Page Components
The page contains other components that will assist in checking Lab Results, Observations, and medication Orders in the same place, as well as ability to add new Orders:
- Labs Flowsheet
- Observations and Measurements
- Medications
- Growth Charts
- Order Profile
- New Order Entry
Application